Quantcast
Channel: BitScope – Gas station without pumps
Viewing all 33 articles
Browse latest View live

FG085 function generator

$
0
0

I finally had time today to assemble the FG085 function generator kit that I bought last September (it’s been a busy 9 months).  I bought the kit from Sparkfun, on sale for $38 (it is now $50 from them or $47 from jyetech, who make the kit).

The assembly is fairly simple, as they’ve already done all the surface-mount soldering, leaving only the through-hole parts to solder—about 200 solder points.  I managed to make two stupid mistakes that required unsoldering—I soldered one of the 21 push buttons on the wrong side of the board and I forgot to peel the protective strip off the LCD display before soldering the BNC connector in place.  The BNC connector is strangely mounted, so that the front panel can’t be removed without unsoldering the connector.  Both errors were ones I realized right after I made them, and were fairly easy to fix.

The function generator seems pretty easy to use, though not all the user interface is intuitive, as there are well-hidden features like that pressing “.” twice allows you to change the duty cycle of the square wave.  Jyetech has pretty good documentation on-line though, including a user’s manual and a schematic for the function generator.

They do direct digital synthesis with a 2.5MHz sampling rate and an 8-bit DAC, then scale the amplitude and add an offset.  At 40Hz and below they drop the sampling frequency to 10kHz,in order to get a more precise frequency. They only claim to go to 200kHz (12.5 samples per period), but their low-pass filter at the DAC has a corner frequency of 1.426MHz (C=180pF, R=470Ω+150Ω) if their schematic is right. (Update 2015 Jun 30: that’s from Schematic_085F.pdf—from Schematic_085G.pdf, the corner frequency should be 713kHz.) So they are not really filtering down to 200kHz, and the software allows the user to enter up to 999,999Hz (in steps of 1 Hz).

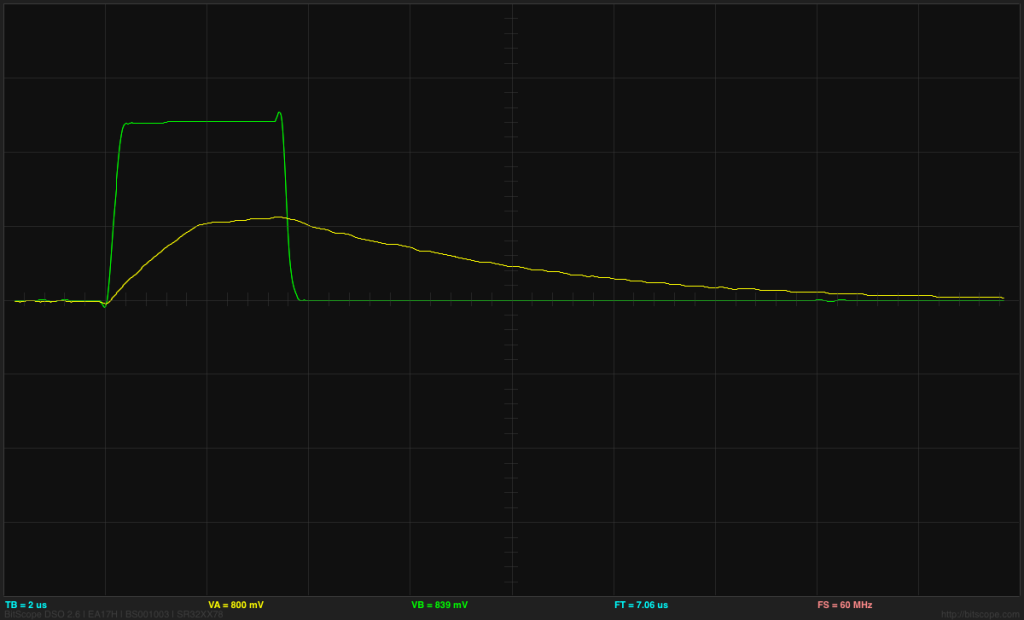
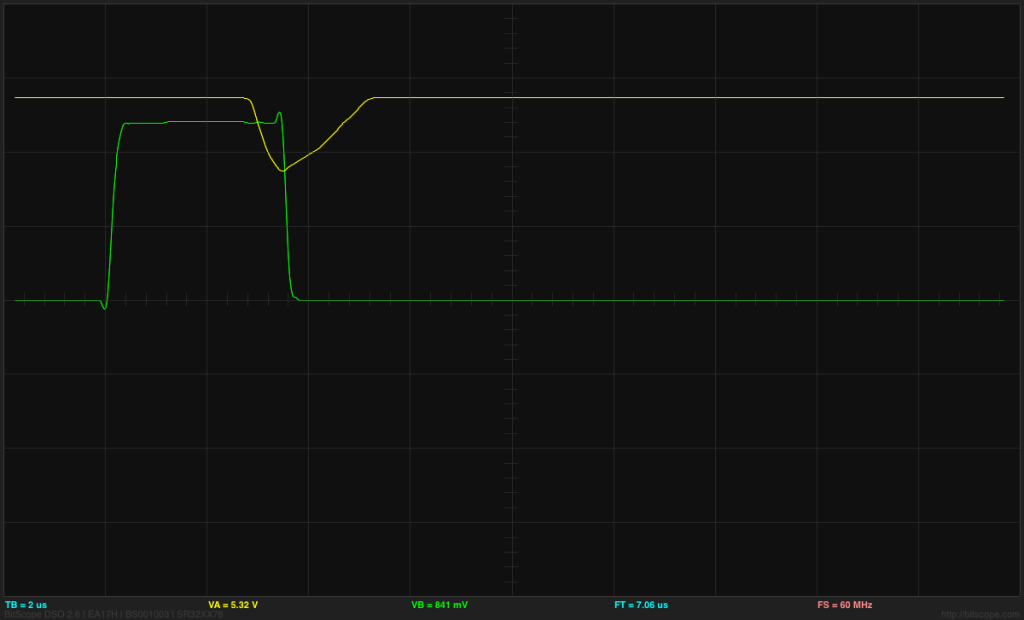
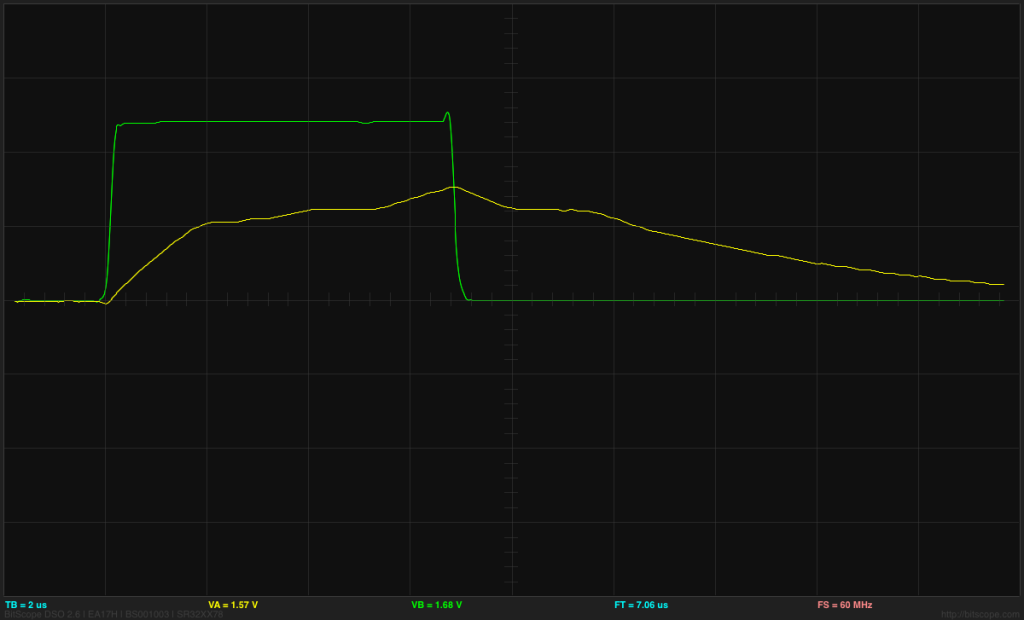
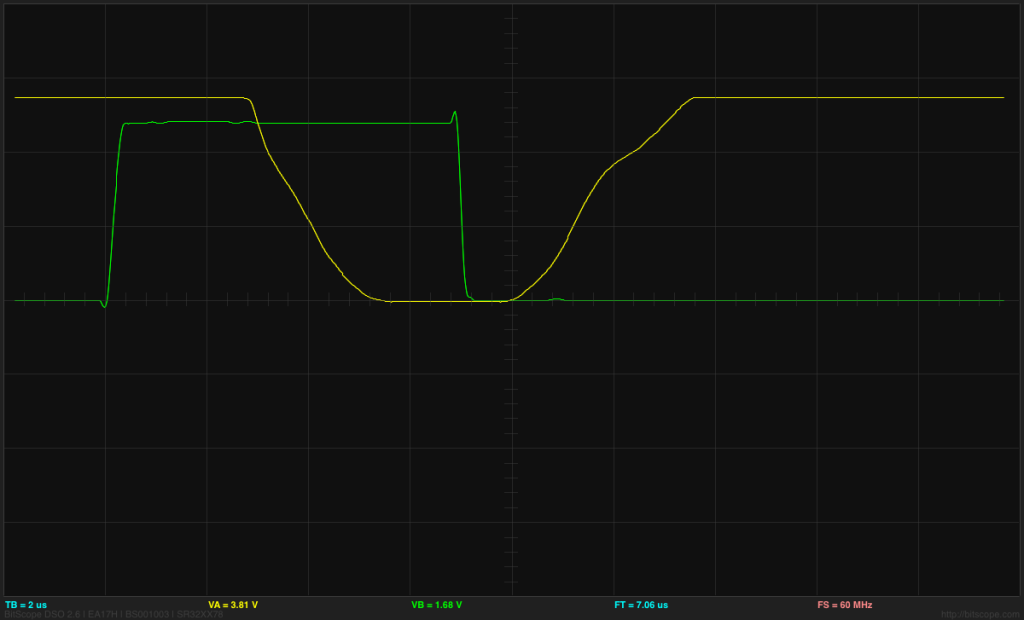
I checked the amplitude of the output using my Bitscope USB oscilloscope, with the FG085 set for 5V peak-to-peak and 0V offset:

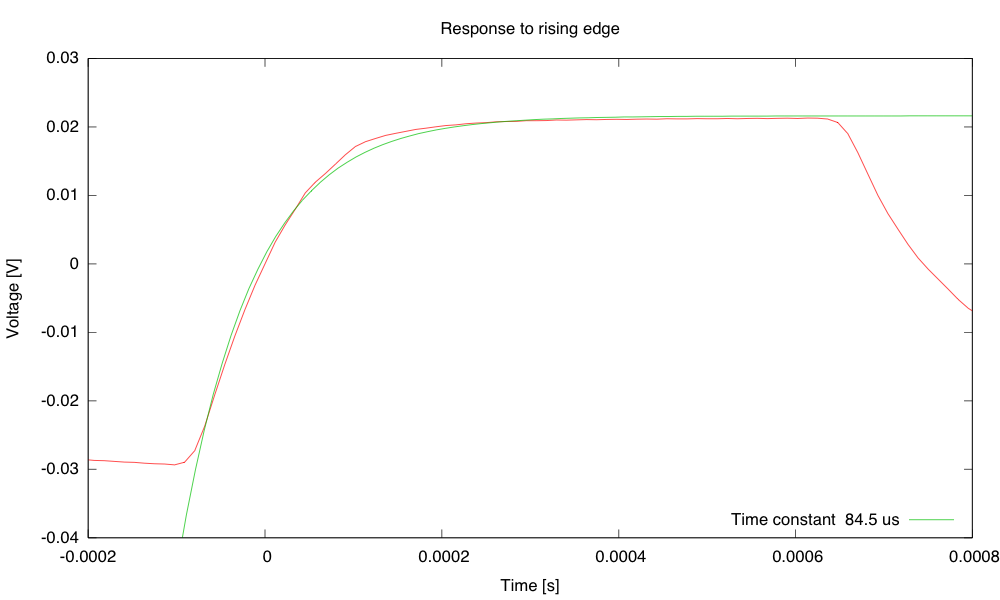
The low-pass filter in the FG085 function generator seems to be set for about 400kHz.

At the higher frequencies the waveform is far from sinusoidal (3 points per period at 833,333Hz), and the beating due to phase change if the period is not exactly a power of 2 times the sampling period makes for pretty dancing patterns on the oscilloscope, but the amplitude is hard to read. I think that the bandwidth is about 400kHz, though the distortion of the waveform is pretty bad when the number of samples is tiny, so treating the signal as a sine wave is a bit dubious above about 100kHz. Because the bandwidth is so different from what I compute from their schematic, I suspected that either their resistor value or capacitor value in the low-pass-filter is misreported. A 2kΩ resistor instead of a 470Ω resistor for R9 leading into a 180pF capacitor C12 would match the behavior better (or C13 was populated despite the schematics).  It is a little hard to figure out the size of capacitors on the PC board (they’re not labeled), but the resistor R9 does appear to be 470Ω, so I’m still a little mystified where the 400kHz corner frequency is coming from.

I don’t know for sure whether the inaccuracy in the voltage measurements at low frequency is from the frequency generator being miscalibrated or from the Bitscope’s lack of calibration, but I suspect the function generator. If the 2V peak-to-peak 1kHz signal out of my Kikusui oscilloscope is accurate (a bit questionable), then the Bitscope is only reading 1% high, so the voltage errors would be in the function generator.

I tried doing an FFT with the Bitscope, to see how much harmonic distortion there is (limited by the 8-bit resolution of both the function generator and the oscilloscope. The oscilloscope reports components at the desired frequency, but also at 2.5MHz ± the desired frequency. These two sidebands are about 40dB down, which is not too bad for an 8-bit DAC.

Incidentally, I noticed that they used a very cheap and noisy DAC—just a resistor ladder with ordinary output pins from the processor driving it. Looking at a low-frequency waveform, there seems to be a glitch of about 30mV (on a 2V peak-to-peak signal) at the 8 transitions that correspond to the top three bit positions. This sort of non-linearity error is what you would expect from the very low-quality DAC they used. On the Bitscope FFT, the errors are near the noise floor, but there is a consistent set of 9th, 11th and 13th harmonics about 50dB below the fundamental. The FFT also points out a 3rd harmonic about 40dB down from the fundamental.

I suspect that they could have made a better function generator for about the same price by using a more modern microprocessor—Freescale’s KL25Z includes a 12-bit DAC with a 550kHz bandwidth, with much better non-linearity than what they achieved—the chip is a bit more expensive, but would add at most $1 to their parts cost—it may actually be cheaper, if it replaces some of their other parts as well.

They adjust the gain and offset in amplifiers after the DAC, but it looks like they just use a 100-position digital potentiometer for the gain and PWM from the ATMega168 for the offset. They monitor the output voltage (before a 22Ω output resistor, not directly at the output), and adjust the offset and voltage to get the peaks more or less right. Given that the digital pot has only 100 positions, the accuracy on that can’t be much better than 1% of the largest amplitude setting, or 0.1V.

For under $50, I did not expect a super-high quality function generator, and I didn’t get one, but FG085 looks like it might be usable for a number of less critical applications. I’ll probably try doing the labs in the book using it—most of them don’t rely on a very high quality sine wave, nor a very high frequency.  The ability to set the DC offset to 0V makes this a much more useful function generator than the one built into the Bitscope or the analog Elenco FG500 that I’ve talked about before.


Filed under: Circuits course Tagged: BitScope, function generator, kits

FG085 function generator bugs

$
0
0

I previously reported on assembling the FG085 function generator kit and measuring its output impedance. I noted that the output impedance was only 46.7Ω, instead of 50Ω, and in Testing nFET body diode with function generator that the output current was limited to about ±5omA, which is ok for 50Ω at 5V peak-to-peak (±2.5V), but not enough when the maximum offset of 5V is added (or –5V, for that matter). I also complained about the buttons (particularly F/T and 0) needing to be pressed up from below, because the return springs weren’t strong enough to push the buttons back up.

I also noted in the first post that the cheap and noisy DAC had some bad glitches.  I decided to investigate that a bit more today, using the new version of PteroDAQ. The voltage calibration was reasonably good on the KL25Z board (about 0.28% too high), so I decided to use that one with 32× hardware averaging.

I set the FG085 function generator to 3.1V peak-to-peak and a 1.7V offset outputting a 1Hz upward ramp, and recorded for about 2 minutes (603882 samples). Looking at a couple of periods shows the glitches:

Glitches are observable in the traces caught by PteroDAQ.

Glitches are observable in the traces caught by PteroDAQ.

Although the glitches are visible, there seems to be some measurement noise. Indeed, zooming in makes the noise very evident:

The glitch at about the ¼ point is visible, but the discrete steps are hard to make out, being buried in noise.

The glitch at about the ¼ point is visible, but the discrete steps are hard to make out, being buried in noise.

I wrote a program (which I’ll be releasing after I do some more polishing on it, as part a suite of tools for analyzing data generated by PteroDAQ) to average copies of repetitive waveforms to reduce noise and get finer temporal resolution. This is similar to the code I wrote for dejittering the BitScope recordings, and I plan to merge the tools so that I don’t need two sets of software tools. Averaging 120 periods makes the waveform much cleaner—here are essentially the same two plots as above, but with the averaged waveforms:

Averaging the waveform reduces the noise.

Averaging the waveform reduces the noise.

After averaging the ¼-way glitch is very clear, and the discrete steps are easy to see and measure.

After averaging the ¼-way glitch is very clear, and the discrete steps are easy to see and measure.

Let’s also look at the top and bottom of the waveform, to see how well the voltage and period are set:

I synchronized the waveforms so that they passed downward through 2V at time=0.  The bottom voltage is approximately 64.44mV.

I synchronized the waveforms so that they passed downward through 2V at time=0. The bottom voltage is approximately 64.44mV.

The top voltage is approximately 3.25630V, and the period is approximately 1.00845s.

The top voltage is approximately 3.25630V, and the period is approximately 1.00845s.

The voltages were supposed to be 150mV and 3.25V, but instead came out as 64.44mV and 3.2563V. The top end is about right but the offset is 1.66V instead of 1.7V and the peak-to-peak voltage is 3.1919V instead of 3.1V. I don’t know if these are hardware errors (as the DAC nonlinearities are) or an off-by-1 error in the software that sets the peak-to-peak voltage.

The period being 0.845% too long is almost certainly a software error—the crystals aren’t that far off. It looks like they are almost exactly 2 steps off on the duration, as if they had added one instead of subtracted one from 256 somewhere. They claim a frequency error of at most 0.0005960 Hz when frequencies are below 40Hz, and the observed error is 14 times that. I am reasonably certain that the error is in the function generator, not PteroDAQ, since I get similar error when measuring with the BitScope digital oscilloscope.

The ¼-way glitch shown above is not the biggest one—the ½-way one is bigger:

The glitch at the midpoint is a transition downward of about 5 steps, instead of a transition upward of 1.

The glitch at the midpoint is a transition downward of about 5 steps, instead of a transition upward of 1.

I suspect that the error comes from not including the output impedance of the digital outputs in making their crude DAC, so that the resistor ladder is not properly balanced. But relying on digital output pins having carefully matched output impedances is a state of engineering sin.

Overall, the FG085 looks like a decent student project (maybe B work), but not the work of professional engineers.

Update 2015-Jul-16: Just a little after publishing this post, I checked the firmware release info on the FG085, and it seems that I don’t have the 113-08502-053 [ 2014.08.01 ]  release of the DDS core firmware which “Fixed a bug that caused frequency error when frequency setting is less than 40Hz.”  So now I have to figure out how to update the firmware.  The manual assumes that you have an AVR programmer, but I’ll be using an Arduino as ISP, which takes a while to look up and set up.


Update 2015-Jul-16 21:29:

I did the firmware upgrade, which took me much longer than I thought it would, because I had to install avrdude again, edit the ArduinoAsISP sketch to work with the Leonardo board, edit the avrdude.conf file to include m48p (it only had the m48, which has a different signature), and generally debug using the Arduino as an in-system programmer.  The command I ran that finally worked was 

avrdude -c avrisp -p m48p -P /dev/tty.usbmodem24141 -b 19200 -U flash:w:113-08502-053.hex -v -v -v -v

I recorded the waveform and now get a period of 1.0005 seconds, which is just within spec for the FG085.

With the up-to-date firmware the function generator now gets a period that is within space (they allow 596 ppm, and this is about 500ppm off).

With the up-to-date firmware the function generator now gets a period that is within space (they allow 596 ppm, and this is about 500ppm off).


Filed under: Circuits course, Data acquisition Tagged: BitScope, dejitter, function generator, PteroDAQ

Measuring BitScope BS-10 input impedance

$
0
0

In Voltmeter impedance I presented a 2-voltmeter way of measuring AC voltmeter impedance, and in Measuring voltmeter input impedance I presented a way of measuring the AC voltmeter impedance with just the voltmeter itself, a function generator, and a resistor that is around the DC resistance of the meter (or a little smaller).

I got measurements of

meter Z
Radio Shack 10.87MΩ || 18.54pF
DT-830B 0.42MΩ || 31.59pF
DT-9205A 13MΩ || 22pF

I decided to apply the same techniques to the BitScope BS-10 USB oscilloscope, getting the following result:

The BitScope provides the standard oscilloscope input impedance of 1MΩ.

The BitScope provides the standard oscilloscope input impedance of 1MΩ.

The BitScope has the standard 1MΩ input impedance with a fairly small 10pF parallel capacitance (probably largely from the 20cm leads I was using). The measurements are a bit noisy, because I was using the provided peak-to-peak voltage measurement, which varies quite a bit from trace to trace.  At high frequencies the waveform is not much like a sine wave, so the results are bit dubious that far out—I did not include frequencies greater than 100kHz in the fit.

The voltage measurements look pretty good, though getting consistent measurements from BitScope’s peak-to-peak measurements with the cursor is a bit difficult:

I think that the voltage drop with no series resistor is from the limits of the FG085 function generator, not from the BitScope oscilloscope.

I think that the voltage drop with no series resistor is from the limits of the FG085 function generator, not from the BitScope oscilloscope.

I should probably average hundreds of waveforms to get a more precise and accurate measurement, but setting that up would be tedious.   I did gather 576 traces of the 200kHz waveform and averaged them together to get a 2.2334V peak-to-peak waveform that looks much more like a sine-wave than I would have expected from the individual traces:

The distortions from a sine wave are barely visible here.

The distortions from a sine wave are barely visible here.

The BitScope is capable of seeing the glitches in the waveform at lower frequencies, like 2kHz, but only barely. The nonlinearities are much better viewed with the PteroDAQ running at lower frequencies.


Filed under: Circuits course, Data acquisition Tagged: BitScope, capacitance, function generator, impedance, USB oscilloscope, voltmeter

New dimmer software

$
0
0

Based on the success of the stroboscope software, I rewrote the dimmer software for my desk lamp (see LED lamp projects for more about the lamps).  The new software provides smoother control of the light levels (having 256 levels plus off, rather than 63 levels plus off) and now has a 256:1 brightness range rather than the approximately 256:6 range of the previous code.

I removed a lot of the general-purpose crap that was inherited from core13 (which was in turn stripped down from the Arduino core software).  I did not get rid of all of core13, so I could probably take out another 50–100 bytes, but the code is down to 222 bytes (and the ATtiny13A has 1kB of flash, so I’m way below the limit).

The actual brightness range of the new dimmer is a bit more than 256:1, because on the shortest pulse the FET doesn’t turn all the way on.  The pulse duration from the ATtiny13A is approximately 3.4µs times the brightness level (9.6MHz clock divided down by 4 and by 8), but I had deliberately slowed the FET transitions by adding a series resistor to the gate, so that nFET doesn’t finish turning on for 5.2µs (as judged by the end of the Miller plateau on the gate).  So at the lowest brightness level, the nFET does not turn all the way on and the voltage on the drain only gets down to 3.5V, which leaves 5.5V across the LED board—enough to turn on the LED, but with only about 10mA, not 118mA. At this low level, the LEDs sometimes flicker, perhaps as a result of some thermal feedback effects. The all flicker together, so the effect is probably in the dimmer’s nFET, not on the LED boards.

ATtiny output (green) and gate voltage (yellow) at 2V/division and 2µs/division for the shortest pulse length.   The gate voltage has not quite reached the end of the Miller plateau before being discharged again.

ATtiny output (green) and gate voltage (yellow) at 2V/division and 2µs/division for the shortest pulse length. The gate voltage has not quite reached the end of the Miller plateau before being discharged again.

ATtiny output (green) and drain voltage (yellow) at 2V/division and 2µs/division for the shortest pulse length.  The BitScope BS-10 oscilloscope clips the voltage to 5.5V—it actually goes to 9V.

ATtiny output (green) and drain voltage (yellow) at 2V/division and 2µs/division for the shortest pulse length. The BitScope BS-10 oscilloscope clips the voltage to 5.5V—it actually goes to 9V.

At the next brightness level, the drain voltage does drop to 0V for at least 2.4µs and stays low enough for the LED board to be at maximum current (below 2.5V) for at least 5.5µs.  There is an enormous difference in brightness between length 2 and length 1 pulses (more like 1:20 than 1:2), because of the low current for pulse length 1, but for length 2 and longer the steps in brightness are pretty much as one would expect from the pulse lengths.

ATtiny output (green) and gate voltage (yellow) at 2V/division and 2µs/division for the shortest pulse length.   The gate voltage has gone past the end of the Miller plateau and started charging past that point. The Miller plateau is also visible on the discharge as the nFET turns off.

ATtiny output (green) and gate voltage (yellow) at 2V/division and 2µs/division for the shortest pulse length. The gate voltage has gone past the end of the Miller plateau and started charging past that point. The Miller plateau is also visible on the discharge as the nFET turns off.

ATtiny output (green) and drain voltage (yellow) at 2V/division and 2µs/division for the  second shortest pulse length.  The BitScope BS-10 oscilloscope clips the voltage to 5.5V—it actually goes to 9V.  The longer pulses allow the nFET to turn on fully.

ATtiny output (green) and drain voltage (yellow) at 2V/division and 2µs/division for the second shortest pulse length. The BitScope BS-10 oscilloscope clips the voltage to 5.5V—it actually goes to 9V.
The longer pulses allow the nFET to turn on fully.

The conversion from the linear 10-bit analog-to-digital reading (0–1023) to pulse lengths is done by the following method:

expon = ADC>>7
frac = 0x80 + (ADC & 0x7f)
pulse_len = ADC < 0x20? 0:  ADC < 0x40? 1: 1+ (frac>> (7-expon))

The stepwise nature of the brightness at low levels is apparent in a plot of the conversion function:

The steps in brightness are quite visible at the low end, but after the first 10 steps, the differences are small enough not to be easily noticed.

The steps in brightness are quite visible at the low end, but after the first 10 steps, the differences are small enough not to be easily noticed.

Overall, I’m pleased with the rework of the dimmer code. I’ll probably have to solder up another of the dimmer boards this summer, since I’ll want one for the light fixture that I haven’t started building yet and one for the Halloween stroboscope.


Filed under: Uncategorized Tagged: Arduino, ATtiny, BitScope, dimmable LED lamps, lamp, Miller plateau

Bitscope function generator review

$
0
0

I’ve previously reviewed a couple of cheap function generators: the Elenco FG-500 and the JYEtech FG085 (also here and here). But I can’t remember whether I’ve reviewed the use of the function generator that is built into the Bitscope BS10 USB oscilloscope.

The Bitscope BS10 function generator is a rather minimal one: it is limited to the 0V–3.3V of the microprocessor on the BS10, with no amplification or offset adjustment.  There is the appearance of an offset adjustment, but it appears to be done digitally before sending data to the DAC—it doesn’t increase the output range. For some purposes the DC offset is not a problem, but for some applications being able to center the output at 0V is important.

The user interface claims to go from 5Hz to 250kHz, but the output of the DAC seems to be low-pass filtered with a corner frequency of about 115kHz, so the upper frequency limit is pretty low.

A bigger concern I have with the Bitscope function generator is that in newer versions of the software they have made it essentially impossible to set a specific frequency (other than some presets that they provide).  They have an “Act on Touch” user interface which requires inhuman degrees of hand control to set values (their old software let you type in the frequencies, which was a bit clunky but allowed precise setting).  They are planning to fix the interface in the next release of the software, so that it will be possible to type numbers for several of the fields—the interface will still be clunky, but that will be a big improvement in usability. (You still won’t be able to see the waveform generator and trigger control panels at the same time.)

One test I did of the FG085 function generator was to measure its frequency using PteroDAQ. I found an off-by-one error there, which had already been noted by the manufacturer, and downloading a newer version of the firmware fixed the problem. I decided to do the same test for the Bitscope BS10 function generator, running it at 5Hz (the slowest I could set it) and recording the sine wave, triangle wave, and square wave.  For the triangle and sine waves, I averaged many dejittered cycles with 20kHz sampling to get a clean waveform oversampled to 5µs (the 50µs transition times are an artifact of the sampling and averaging—the DAC settles single steps in less than 5µs, according to my analog oscilloscope).

I fed the square wave to a digital input and timed 200 cycles, to a resolution of 28ns. The period measurements with sine, triangle, and square wave were consistent (to within the measurement error—the resolution is obviously much better for the timing of the square wave), getting 199.60722ms as the period for the waveform, which is 511/512 of the correct 200ms (to within 22ppm, which is about what one would expect of the difference between two cheap crystal oscillators).  So Bitscope has an off-by-one error in their waveform generation.  (I’ve notified them, and they hope to fix this in the next release—the bug has been in their code for the past several releases without them noticing it.)  The missing sample seems to be at the end of the downward ramp.

They claim that their waveform generator can do arbitrary waveforms “Up to 1024 steps (samples) per period are supported with arbitrary (user programmable) data.” Because they have only an 8-bit DAC (same as the FG085), there is no reason to go to more than 512 steps on a triangle wave—you are visiting each value exactly once in each direction then.  For a sine wave, one could get slightly lower quantization error by having more steps (by making the timing of the transitions between steps slightly more accurate) even though the biggest contribution to the quantization error is the quantization of values rather than the quantization of time. But the steps that I see in the sine waveform are about 390µs apart which implies 512 steps per period for the built-in sine wave, not 1024.  (I’ve not tried figuring out the interface for doing arbitrary waveforms—I believe it involves creating csv (comma-separated values) files of the desired waveform.

The 8-bit DAC on the Bitscope is better than the awful one on the FG085, but there are still noticeable glitches at the mid-point (not quite enough to make the DAC non-monotone).

Overall, the Bitscope function generator is better than nothing, but not particularly impressive.  If the JYEtech FG085 hadn’t cheaped-out on putting in a real DAC, it would be by far a better function generator, but with the awful non-monotonicity of the FG085 fake DAC, it is a bit of tossup whether the Bitscope function generator or the FG085 is more useful.

If you buy the Bitscope oscilloscope, buy it for the oscilloscope capabilities—the after-thought function generator does not add much value.


Filed under: Circuits course, Data acquisition Tagged: BitScope, function generator, oscilloscope, PteroDAQ

Ultrasonic rangefinder pings

$
0
0

Earlier today I made a comment:

One of these days (when I’m not working on my book or teaching classes) I’ll have to get out the ultrasonic rangefinders again and experiment with them to find out what the problem really is. I think that the problem is that they are just sending a pulse and listening for the echo, and that the echoes are weak from small targets. It would take some sophisticated signal processing to detect and deconvolve the echoes when they are weak, and the cheap sensors just don’t have the capability to do that.

The MaxBotix MB1020 that I have only claims a 1″ resolution, which is probably not good enough for physics labs (they also make sensors for which they claim 1mm resolution). It sends out a 42kHz square-wave burst and provides 3 different ways of interfacing the return value. It has a free-running mode that could interface well with PteroDAQ.

The Ping))) sensor that I have uses a 40kHz square wave (8-cycle burst), but does not report a resolution—I suspect that resolution is limited by the noise in the filter that detects the return pulse, and varies a lot depending on the strength of the return signal. It requires sending a pulse to the sensor to initiate each measurement—something that PteroDAQ doesn’t currently offer (though we’ve thought a bit about how to add that sort of capability to PteroDAQ).

Since it is Sunday today, and I was feeling too fuzzy-headed to do any more work on the book, I decided to use my new microphone pre-amplifier and the Bitscope oscilloscope to look at the pings put out by the Maxbotix  MB1020 and Ping))) ultrasonic rangefinders. (Note: I bought both of these 4 years ago, and they may well have changed designs somewhat since then.)

The electret microphone I’m using only has specifications to 20kHz, but it looked like it had slow rolloff, so I figured it would still respond at 40kHz.

The Ping))) sensor datasheet says that it sends out 8 cycles of 40kHz waveform when triggered, so I wrote a little routine to trigger it repeatedly (on an Arduino Duemilanove board, so 5V power).  The Maxbotix sensor triggers itself as long as power is supplied, so I powered it off the same board, again at 5V.

With the gain on my mic preamplifier turned all the way up, I got good records of the signals:

The Ping))) sensor seems to do 8 pulses as claimed (though it may be 9), and then lets the transducer ring for a long time.

The Ping))) sensor seems to do 8 pulses as claimed (though it may be 9), and then lets the transducer ring for a long time.

The Ping))) sensor can get away with allowing long ringing, because they listen to the echo with a different transducer. I also looked at the signals going to the transmit transceiver, which goes from 3.4V when off to –4.5V for the 8 pulses, then shows the ringing:

The initial part of the waveform is the driving signal—the ringing afterwards is from the transducer, not from the op amp.

The initial part of the waveform is the driving signal—the ringing afterwards is from the transducer, not from the op amp.


The Maxbotix chip has a more complex output waveform:

The Maxbotix pulse is at 42kHz as claimed, but the envelope is rather complicated.

The Maxbotix pulse is at 42kHz as claimed, but the envelope is rather complicated.

The Maxbotix sensor is louder, and I was wondering whether they were doing active cancellation to try to stop the ringing—they need to have the ringing stop quickly in order to turn the transducer around and use it as a receiver.

The input pulse to the Maxbotix transducer is more symmetric, a 9.4Vpp signal instead of the 7.9V non-centered signal for the Ping))) sensor.

The Macbotix sensor has 13 cycles of excitation, and the sensor does not seem to exhibit much ringing afterwards electronically (though it certainly did when listening with the mic).

The Macbotix sensor has 13 cycles of excitation, and the sensor does not seem to exhibit much ringing afterwards electronically (though it certainly did when listening with the mic).

Clearly they are not doing active cancellation of the ringing. Another possibility just occurred to me—they may be driving a 40kHz resonant transducer at 42kHz, and the complex envelope could be a beat pattern between the driving signal and the natural resonance. But if that were the case, I’d expect the ringing to shift frequency towards the 40kHz resonance, and I’m not seeing that shift, even when I use the Bitscope to zoom in on the later parts of the ringing.  Despite not seeing a frequency shift, I think that the beat pattern in the best explanation I have for the waveform envelope.  That envelop shaping would also explain why Maxbotix is using  42kHz signal, when 40±1kHz seems to be the standard spec for most cheap ultrasonic transducers.


Filed under: Uncategorized Tagged: BitScope, microphone pre-amp, ultrasonic sensor, USB oscilloscope

H-bridge Class-D works

$
0
0

The simplified class-D amplifier using a cMOS H-bridge works! Using an inverter chip (in this case a 74HC14N Schmitt trigger chip) to provide separate amplifiers for each nFET and pFET allows using the TLC3702 rail-to-rail comparator, despite its rather wimpy current output. Using an H-bridge allows 10V swing with only a single 5V power supply (in my case, just USB power from my laptop).  Driving an inductive load (a 220µH inductor in series with an 8Ω loudspeaker) got clean 800ns rise and fall times, and the LC filter design made almost all the PWM carrier frequency disappear from across the loudspeaker.  I got no noticeable shoot-through current, and I couldn’t see the Miller plateaus on the gate voltages (I’ll check that again tomorrow with my faster analog oscilloscope—I was just looking at the signals with the Bitscope B10 with the DP02 differential probe).

I was getting a rather annoying amount of 60Hz hum, probably from the microphone preamplifier.  I’ll have to play with it a bit tomorrow to see if I can avoid the hum pickup.

The high frequency triangle waves from the FG085 function generator are not very good, but I cleaned up the digital-to-analog converter steps by adding a 10nF capacitor across the output.  With the ~47Ω output resistance of the FG085, this makes a 340kHz low-pass filter, which is fine for triangle waves around 50—100kHz.  Any larger capacitor and the waveforms started getting too sinusoidal.

I think I’ll rewrite the Class-D lab around an H-bridge design, rather than the open-collector comparators and 3 power supplies. The parts are about $1.50 more (extra nFET and pFET, more expensive comparator, extra inverter chip), but the design is much simpler, and the PWM waveform clearer.


Filed under: Circuits course Tagged: BitScope, class-D power amplifier, function generator, H-bridge, PWM

H-bridge Class-D hum problem solved

$
0
0

I H-bridge Class-D works I mentioned

I was getting a rather annoying amount of 60Hz hum, probably from the microphone preamplifier.  I’ll have to play with it a bit tomorrow to see if I can avoid the hum pickup.


It turned out to be a fairly simple, but unexpected problem.  The TLC3702 comparator chip has 2 comparators in the package, and I had not connected anything to the second comparator.  Connecting the inputs to ground eliminated the hum!  I think that what was happening was that 60Hz pickup on the unconnected input was causing the second comparator to swing back and forth at about 60Hz, and that this was coupled internally to the comparator I was using (probably through the shared power connections). By silencing the second comparator, I removed this source of hum.

My son also noticed a high-pitched noise that was barely audible to me.  I figured that the source was probably the low-quality triangle wave from the FG085 function generator. If the period is not an exact multiple of 250ns, then the sampling of the triangle wave gradually shifts phase, and that changing phase turns into a PWM signal that is audible on the speaker.  By selecting 62.5kHZ, exactly 64 clock pulses of the FG085 clock, as my PWM frequency, I avoided phase shifts and eliminated the high-pitched whine.


Filed under: Circuits course Tagged: BitScope, class-D power amplifier, function generator, H-bridge, PWM

Digilent Analog Discovery 2 USB Oscilloscope

$
0
0

I have recently learned about a new USB oscilloscope, Digilent’s Analog Discovery 2, which seems to be a step up from the BitScope BS10 USB oscilloscope that I currently own. Digilent’s offering has differential inputs, 14-bit ADC (instead of 8), 100MS/s (instead of 40MS/s), and much nicer-looking user interfaces (no more black background!).  It costs a little more ($279 vs. $245, both costing more to get BNC connectors for higher-speed oscilloscope probes), but Digilent has an academic program that reduces the cost to only $179, so that even with an extra $20 for the BNC adapter and $20 for scope probes, the price is still lower than the BitScope.

I’m considering getting the Analog Discovery 2 scope (if I qualify for the academic discount), but I’ll probably wait until I replace my laptop.  The free Waveforms 2015 software runs on a wide range of Windows versions, but only 10.9 or newer on Mac OS.  (It also runs under some versions of Linux).  I’m still running Mac OS 10.6.8 on my laptop, and I don’t want to “upgrade” to a newer OS on the old hardware—I’m planning to replace the laptop this year, but I’m waiting to see whether Apple comes out with a usable MacBook Pro in 2016, or whether they’ve gone all in for connector-less laptops, in which case I’ll probably have to switch to a cheaper, but clunkier Linux laptop.

One of the things I like about Digilent’s marketing is that they have a very thorough reference manual online, which goes through the design of the hardware, explaining the schematics and some of the design choices for what chips they used. The online reference manual for Waveforms 2015 seems decent, but not as thorough as the hardware manual.

I’m curious whether any of my readers have tried the Digilent USB oscilloscopes.


Filed under: Circuits course Tagged: BitScope, Digilent, MacBook Pro, oscilloscope, USB oscilloscope

Dehumidifier

$
0
0

In Average annual power use, I mentioned

I will be buying a dehumidifier for our house, to reduce the condensation on the walls. Current Energy Start rated dehumidifiers remove about 1.85 liters of water per kWh used, and I don’t think we need to remove 2775 liters of water a year (7.6 l/day) from our house, so the dehumidifier will add nothing to our electricity bill.  Based on reviews (in Consumer Reports and on Amazon), we’re looking at the 30-pint Whynter RPD-321EW Energy Star Portable Dehumidifier, as it has good performance in cool rooms (our house gets quite cool in winter, especially when we’re both at work) and is relatively easy to empty (we don’t have a convenient way to rig up a drain hose).

We bought the dehumidifier and it seems to work ok. The timer is a bit crude, as it does not have a time-of-day clock, but you can set up a delay of up to 24 hours for turning on and turning off.  This means that we’ll have to reset the timer daily. That’s not as much of an imposition as one might think, because we have to empty the water daily any way.  People running a dehumidifier with a drain hookup might find the need to reset the timer more of a nuisance.

Our biggest disappointment with the dehumidifier is that it is loud. They claim that it is only 53dB, but it seems louder than that to me—unfortunately, I don’t have a sound pressure meter to measure it with. The compressor is fairly quiet, but the fan is loud, which suggests a poorly designed air flow. We can run the dehumidifier in the living room, but not in the bedroom, because of the noise it makes.

I can’t measure the loudness of the dehumidifier in calibrated units, but I could record chunks of sound from it using an electret mic, an amplifier, and the BitScope USB oscilloscope. I then wrote a program using SciPy to take the FFT of each recorded trace, and averaged the absolute values of FFTs for a hundred or so traces:

The noise is "pink" noise, with more low-frequency components than high frequency ones. The 5kHz cutoff is not an artifact of my amplifier, which has fairly flat gain out to about 100kHz, nor of the microphone, which is fairly flat to at least 20 kHz.

The noise is “pink” noise, with more low-frequency components than high frequency ones. The 5kHz cutoff is not an artifact of my amplifier, which has fairly flat gain out to about 100kHz, nor of the microphone, which is fairly flat to at least 20 kHz.

We can use a lower sampling rate to zoom in on the lower frequency end of the spectrum:

The 60Hz peak is sharper here, and 120Hz is clearly missing, but the next several harmonics of 60Hz are present. I don’t have an explanation for the dip between 400Hz and 480Hz.

I don’t know whether the spike around 1067Hz (in both plots) is an artifact of my test setup or is present in the sound. I suspect it is present in the sound.

The dehumidifier takes 340 watts to run (about 40W for the fan and 300W for the compressor), and it extracts about 5 pints in 5 hours (somewhat slower than its claimed 30 pints/24 hours, but that is probably based on warmer, wetter air, which is easier to extract water from). We only run for 5 hours a night, because we don’t want to be woken up by the loud beeping that occurs when the 7-pint bucket fills up.  (There is no way mentioned in the manual to disable the alarm—my son and I might disassemble the dehumidifier to disconnect the irritating beep.)

We plan to run the dehumidifier only during off-peak hours (at night or weekend days), for about 45 hours a week, which will consume about 800kWh a year. At PG&E off-peak rates, that is around $120 a year, but we had $98 of unused Net-Electric Metering (NEM) credits, and our minimum bill is around $111, so the extra electricity use will make no change in our bill. We will probably want to pay for carbon offsets, though, since we are increasing our carbon footprint by about 0.23MT (so about $2 in carbon offsets).


Filed under: Data acquisition Tagged: BitScope, dehumidifier, solar power

Improved spectral response for dehumidifier noise

$
0
0

In Dehumidifier, I provided spectral analysis of the sound from the 30-pint Whynter RPD-321EW Energy Star Portable Dehumidifier, using my BitScope USB oscilloscope to record the sound and averaging the absolute value of the FFT over 100 short traces. Today I decided to improve the FFT analysis by using the scipy.signal.welch() function to split a longer trace into windows, apply a Dolph-Chebyshev window-shaping function, and average the resulting power spectra. The main improvement here is the use of the window-shaping function.

I used PteroDAQ with a Teensy LC board to record at 15kHz, which was as fast as I could go with 4× averaging communicating with my old MacBook Pro laptop. Based on the Bitscope recordings, though, that should include all the interesting signal, which appears to be limited to about 5.4kHz. I could only record for about 330,000 samples to avoid overrunning the USB buffer and dropping samples, so I also tried 12kHz, which allowed me to run longer. The analysis looked much the same, with no apparent reduction in the noise floor, so I’ll only present the 15kHz results. (Note: when I get a new laptop this fall, I should be able to run at this sampling rate for much longer, which should allow smoothing out more of the noise.)

The dehumidifier looks very much like 1/f noise, with a big spike around 1050Hz. The spikes at 60Hz, 120Hz, 240Hz, and 360Hz may be electrical noise picked up by the sound amplifier, rather than acoustic noise.

The dehumidifier looks very much like 1/f noise, with a big spike around 1050Hz. The spikes at 60Hz, 120Hz, 240Hz, and 360Hz may be electrical noise picked up by the sound amplifier, rather than acoustic noise.

Using Welch’s method and a proper window function results in a much cleaner spectrum than before. I used a 216 FFT window for the analysis, since I had plenty of data, which gives a fairly fine resolution of about 0.23Hz. The 60Hz spike is appearing at 58.36Hz, which is a little troubling, as the PteroDAQ crystal and the power company both have better frequency control than a 2.7% error. The 120Hz, 240Hz, and 360Hz spikes are at most one bin off from where they should be, so I don’t understand the shift at 60Hz.

I checked my code by testing with a recording of a triangle wave, and found that Welch’s method with an 80dB Dolph-Chebyshev window did an excellent job of removing the spectral smear that I was getting by just averaging rectangular FFT windows (my first approach). The noise floor for Welch’s method on those measurements was pretty much flat across the entire spectrum (maybe rising at higher frequencies), so the 1/f plot here is not an artifact of the analysis, but a real measurement of the acoustic noise. Using 60dB window resulted in a higher noise floor, but 100dB and larger did not lower the noise floor, so I stuck with 80dB as a good parameter value. It might be useful to use other values if the FFT window width is changed or the noise in the data is different.

I’ve included the source code for the program, so that others can use it. It does require that SciPy be installed, in order to use the scipy.signal package.

#! /usr/bin/env python3

"""Sun Sep  4 21:40:28 PDT 2016 Kevin Karplus

Reads from stdin a white-space separated file
whose first column is a timestamp (in seconds) and
whose subsequent columns are floating-point data values.

May contain multiple traces, separated by blank lines.

Outputs a tab-separated file with two columns:
        the frequencies
        the Fourier transform

"""

from __future__ import print_function, division

import argparse
import sys
from math import sqrt
import numpy as np
try:
    from future_builtins import zip
except ImportError:     # either before Python2.6 or one of the Python 3.*
    try:
        from itertools import izip as zip
    except ImportError: # not an early Python, so must be Python 3.*
        pass

import scipy
import scipy.signal

class Trace:
    """One contiguous trace consisting of two 1D numpy arrays of the same length
        times:  timestamps in seconds
        values: arbitrary floats
      and sampling_freq: the sampling frequency in Hz
    """
    def __init__(self,times,values,sampling_freq=None):
        self.times=np.array(times)
        self.values=np.array(values)
        assert self.times.shape==self.values.shape
        if sampling_freq is None and len(times)>1:
            sampling_freq = (len(times)-1)/(times[-1]-times[0])
        self.sampling_freq=sampling_freq
    def __len__(self):
        return len(self.values)

def read_trace(file, column=2, sampling_freq=None, echo_comments_to=None):
    """Generator that yields traces from tab-separated rows of data.
    Each row contains a timestamp in the first column and any number of subsequent
    columns, one of which is selected to be the values for the trace.

    New traces are started whenever the timestamp in the first column decreases.

    If sampling_freq is None, the sampling_freq for the
    trace is deduced from the timestamps.

    Comments and blank lines are echoed to a file-like object,
    echo_comments_to, if it is not None.
    """
    times=[]    # time values (in seconds) from frst column
    values=[]   # values from the specified column

    for line in file:
        line=line.strip()
        if line.startswith('#') or len(line)==0:
            if echo_comments_to is not None:
                print(line, file=echo_comments_to)
            continue
        fields=line.split()
        if len(fields)>=column:
            time=float(fields[0])
            if times and time<times[-1]:
                yield Trace(times=times, values=values, sampling_freq=sampling_freq)
                times=[]
                values=[]
            times.append(time)
            values.append(float(fields[column-1]))
    if times:
        yield Trace(times=times, values=values, sampling_freq=sampling_freq)


def posint(opt):
    """returns int(opt) if that is positive,
            otherwise raises an argparse.ArgumentTypeError
    """
    try:
        x = int(opt)
    except:
        x=None
    if x is None or x<=0:
        raise argparse.ArgumentTypeError("{} is not a positive integer".format(opt))
    return x

def parse_options(argv):
    """Parse the options and return what argparse does:
        a structure whose fields are the possible options
    """
    parser = argparse.ArgumentParser( description= __doc__, formatter_class = argparse.ArgumentDefaultsHelpFormatter )
    parser.add_argument("--sampling_freq","-s", type=float,
            default=None,
            help="""Sampling frequency (in Hz).
            If none specified, then estimate sampling frequency from the timestamps.
            """)
    parser.add_argument("--window", "-w", type=posint,
            default=(1<<16),
            help="""Max window size (in samples) for FFT.
            Longer traces will be split up into windows of this size
            """)
    parser.add_argument("--column" , "-c", type=posint, default=2,
           help="""What column should be Fourier transformed?""")
    parser.add_argument("--welch" , type=float, default=None,
           help="""Use Welch's method to produce averaged spectrum from windows.
           Value is dB difference between main lobe and sidelobes for Dolph-Chebyshev window.
           80 seems reasonable with 16-bit data (60 produces a higher noise floor, without noticeably narrowing the spikes).
           Note, sqrt is used to get amplitude spectrum, rather than power spectrum. """)
    options=parser.parse_args(argv[1:])
    return options


def main(argv):
    """parse the command line arguments and do FFTs
    """
    options = parse_options(argv)
    sampling_freq= options.sampling_freq

    # input file may contain separate time traces.
    # Each new trace stats when the time value is less than the previous time.

    for trace in read_trace(sys.stdin, column=options.column,
                        sampling_freq=options.sampling_freq,
                        echo_comments_to=sys.stdout):
        print("# using sampling frequency {:.6f} Hz for FFT of trace with {} samples".format(trace.sampling_freq,len(trace)))


        fft_len=64      # length of the fft to do
        while fft_len<len(trace) and fft_len<options.window:
            fft_len *= 2

        if options.welch is not None:
            welch_f,welch_spectrum = scipy.signal.welch(trace.values, trace.sampling_freq, nperseg=fft_len, scaling="spectrum", window=("chebwin",options.welch))
            print("")       # separate the traces
            for f,w in zip(welch_f,welch_spectrum):
                print("{0:.7f}\t{1:.6f}".format(f, sqrt(w)*(fft_len//2)))
        else:
            for start in range(0,len(trace),fft_len):
                window=trace.values[start:start+fft_len]

                # remove DC component, so that zero-padding makes sense
                # WARNING: This in-place change could introduce errors if
                # overlapping windows are allowed.
                dc = sum(window)/len(window)
                window -= dc

                fft = scipy.fftpack.fft(window, n=fft_len)
                fft[0] += dc

                print("")       # separate the traces
                print("# Window width {} = {:.3f}s".format(fft_len,fft_len/trace.sampling_freq))
                for i,f in enumerate(fft[0:fft_len//2]):
                    print("{0:.7f}\t{1:.6f}".format(i*trace.sampling_freq/fft_len, f))


if __name__ == "__main__" :
    sys.exit(main(sys.argv))

Filed under: Data acquisition Tagged: BitScope, dehumidifier, FFT, PteroDAQ, scipy, spectrum, Welch's method

Pulse monitor using log amplifier

$
0
0

I am currently rewriting the optical pulse monitor lab for my Applied Electronics for Bioengineers book, because I’ve moved it earlier in the course, and because I need to remove the calculation of how big the signal should be, which never worked out very well.  There were way too many assumptions in the calculation, and it turned out to be much easier and more accurate to “try it and see” than to do the calculations.

I always do the labs (often several times in different ways) while writing the lab chapters, so I’ve been playing with pulse monitors again.  I’ve decided that I will definitely have the students do a logarithmic transformation of the photocurrent to voltage, as that eliminates the need to guess a resistance value for the first-stage amplifier.  The amplifier can be designed in two stages, with the first one doing the logarithmic conversion and the second one providing sufficient gain over the desired frequency range (where “sufficient” gain is determined by measuring the output of the first stage).

In Using 4¢ diode for log-transimpedance, I talked about using a 1N914 diode as the feedback element of a transimpedance amplifier to get an output voltage as (roughly) the log of the input current.  There are actually two circuits that are subtly different ways to convert the log of current to voltage:

Two circuits that convert the logarithm of light intensity to voltage.

Two circuits that convert the logarithm of light intensity to voltage.

One of the exercises in the book is to compare the circuits (particularly looking at the constraints on what Vref can be in each).

Because I’d not played with it before, I tried using the unity-gain buffer design this weekend, to make sure the circuit worked and to see whether a single-stage amplifier provided enough signal to record with PteroDAQ using the 16-bit ADCs in the Teensy boards. I was also interested in trying out a new design for holding the phototransistor, so that students could experiment with ambient-light pulse monitors and cisillumination, where the illuminating LED is on the same side of the finger as the phototransistor.  In previous years we have always used transillumination, shining the light through the finger, but most wearables use a cisillumination design, because it is mechanically simpler and much cheaper to make.

I played around with a couple of different ways to make a finger cradle and ended up with the following design:

This is cut from a scrap of some softwood (pine? fir?), with a 1" diameter hole for the finger, a ¼" hole at right angles for the wires, and two ⅛" holes between them for the 3mm LED and phototransistor.

This is cut from a scrap of some softwood (pine? fir?), with a 1″ diameter hole for the finger, a ¼” hole at right angles for the wires, and two ⅛” holes between them for the 3mm LED and phototransistor.

The finger cradle worked great for ambient light, but when I tried using it for cisillumination, I could not get it to work—I had plenty of photocurrent, and if I modulated the LED the photocurrent was modulated, but I never saw a fluctuation that corresponded to the pulse in my finger. It turned out that the problem was that the wood is too transparent—I was getting so much light through the wood, that the fluctuation in what was returned from my finger was a tiny fraction of the total light—too small to be visible above the noise floor.

I mentioned this problem to my wife, who suggested I use black electrical tape. I’m not sure she quite understood the problem, since the wood was solid between the LED and phototransistor, but her solution was a good one—I just needed to put the tape in the middle of the block of wood!

By cutting between the two 3mm holes I could put black electrical tape to block the short-circuiting light path.

By cutting between the two 3mm holes I could put black electrical tape to block the short-circuiting light path.

With this design I could get small but recordable signals with either ambient light or cisillumination:

Response of first stage amplifier with an LED desk lamp shining through my left thumb.

Response of first stage amplifier with an LED desk lamp shining through my left thumb.

Output of first stage using an IR emitter on the same side of the left thumb as the phototransistor.

Output of first stage using an IR emitter on the same side of the left thumb as the phototransistor.

Both the plots above are a little misleading, as they were sampled at 60Hz, to alias out any 60Hz or 120Hz interference. With steady bright light from my LED desk lamp, I got similar plots even at 600 Hz, but with compact fluorescent illumination, the signal was buried in 120 Hz interference:

With 600 Hz sampling, it is easy to see the effect of modulated light.

With 600 Hz sampling, it is easy to see the effect of modulated light.

I don’t particularly like the electrical tape and wood approach to making the finger cradle—it is a bit fragile, and the tape needs to be replaced frequently.  Furthermore, ambient light reaches the phototransistor through the sides and ends of the block, unless the whole thing is wrapped in electrical tape. I think that I’ll buy a chunk of black ABS plastic and try making the whole thing out of it. I can probably get a dozen finger cradles out of a 1′ length of plastic, if I don’t mess anything up (and if all my drills work with ABS—I’ve never worked with ABS as anything but Lego bricks).  Another alternative is to go to the hardware store and see how thick the black ABS couplers are—I might be able to make a finger cradle by cutting one in half lengthwise, if the wall thickness is at least 6mm.  I’d still have to add something to keep it from rolling around.

In the past, I’ve thought about using pulsed light to make pulse monitor measurements that are less sensitive to fluctuations in ambient light. The idea is that I would make a measurement with the LED off, turn the LED on, wait a little while for the sensor to settle, then make another measurement. The difference between the measurements would be due just to the LED light, if the ambient light is changing slowly enough not to be very different between the measurements. I’m not sure that this is a good idea (the large change in light level means that there would have to be less analog amplification than for steady illumination, for example), but I was curious how long the on-pulse would have to be to get good measurements.

I hooked the IR emitter up to a hysteresis oscillator, to get nice sharp square waves, then recorded the output of the amplifier with my Bitscope USB oscilloscope. I used the differential probe to get an extra gain of 5 and AC coupling. I recorded 1156 traces, then used my retriggering and averaging program to superimpose and average the pulses. I ended up with between 2300 and 3500 pulses being averaged (depending where on the waveform you look).

The circuit responds fairly quickly to a rising edge, roughly like having an RC time constant of 84.5µs.

The circuit responds fairly quickly to a rising edge, roughly like having an RC time constant of 84.5µs.

The response to a falling edge is slower, roughly like an RC time constant of 207.8µs.

The response to a falling edge is slower, roughly like an RC time constant of 207.8µs.

The response to rising and falling edges is quite different, because of the nonlinear nature of the diode. When we are charging the parasitic capacitance, we have a fairly large photocurrent to do it with, but when we are discharging, the current gets quite small as the voltage across the diode drops. With a linear system, response to a positive step and negative step would be identical, except for the sign.

Both response times are fast enough that the shape we were seeing for the pulse waveforms is due to changes in the opacity of the finger, not due to distortion or filtering in the amplifier.  There is a sudden increase in opacity, followed by a gradual recovery as the blood flows through the capillaries and veins out of the thumb.

If I were to try the difference between LED-on and LED-off measurement, I’d want to have the LED on for at least 400µs, then off for at least 1ms.  (I’d probably do on for 400µs, then off until the next 1/60s tick, making a 2.4% duty cycle for the LED.)

Note also that the 50mV swing here is much larger than the 3mV swing that I got from pulse measurements, so gain would have to be limited to avoid clipping.


Filed under: Circuits course, Data acquisition Tagged: ABS plastic, BitScope, log amplifier, PteroDAQ, pulse, pulse monitor, transimpedance amplifier

FET Miller plateau with Analog Discovery 2

$
0
0

I recently bought myself a birthday present: an Analog Discovery 2 USB oscilloscope. The device normally costs $279, but  I qualify for the academic discount, which brought the price down to $179—a very good deal.  This oscilloscope is better in every way than the Bitscope BS10 that I bought about 4 years ago: functions, resolution, bandwidth, software, … . The Analog Discovery 2 is also cheaper (at least with the academic discount).

I’ve been playing with it a little bit, and I decided to try to reproduce a few of the plots that I have done before.  This post is about creating the plot of the Miller plateau for an nFET (see, for example, More on nFET Miller plateau).  With the Bitscope, I had to filter the 5V power (which was just passed through the device, record many traces, process them with a program I wrote myself to remove the jitter in the triggering, average them, and plot with gnuplot).

With the Analog Discovery 2, I set the built-in power supply to 4V, set the function generator to a 1kHz square wave from 0V to 4V, and put the scope leads to measure Vgs and Vds for the following circuit:

The 100Ω gate resistor is to limit the current from the 1kHz square wave generator, so that the Miller plateau is stretched out in time.

This setup produced a very nice plot without any averaging—the Waveforms 2015 software that comes with the Analog Discovery 2 does the interpolation between samples to dejitter the waveform:

With a 100Ω gate resistance, the plateau is about 146ns long (easily measured with a pair of cursors not shown in this image).

With a 100Ω gate resistance, the plateau is about 146ns long (easily measured with a pair of cursors not shown in this image).

The average voltage is about 2.87V, so the current is (4V-2.87V)/100Ω=11.3mA, and the gate drain charge is 1.65nC, about half the 3.2nC on the data sheet (which was measured with different circuit parameters and is supposed to be a worst-case).  Note that this is a single trace, but multiple traces show almost no jitter, even though we are sampling at the full  100 Msample/second rate.  Averaging the traces would not make much difference in the signal.

If I replace the 100Ω gate resistor with a wire, I get a shorter Miller plateau:

With no gate resistor, the Miller plateau is only about 40.2ns long and averages 2.987V.

With no gate resistor, the Miller plateau is only about 40.2ns long and averages 2.987V.

If we assume 1.65nC in 40.2ns, we get a 41mA current, and (4V-2.987V)/41mA=24.7Ω for the output impedance of the function generator.  I may not have placed the cursors in exactly the same places on both curves, so this is a terrible way to estimate the output impedance of the function generator.

If I look at the square wave with nothing but the scope attached, then I see a voltage of about 4.005V.  With a 100Ω load, I see 3.44V, which gives an output impedance of 16.4Ω.

Of course, the square waves are not completely square, which may affect the Miller plateau measurement at high speed, but the edges are pretty sharp:

The falling edge takes about 50ns.

The falling edge takes about 50ns.

The rising edge takes about 50ns.

The rising edge takes about 50ns.

The edges are limited by the wiring, and I may be able to get better edges by using the BNC adapter board and 50Ω coax cable, rather than the wires provided, but I don’t happen to have any BNC coax cable handy.


Filed under: Data acquisition Tagged: Analog Discovery 2, BitScope, function generator, nFET, USB oscilloscope
Viewing all 33 articles
Browse latest View live